
A field story · Incus · First access
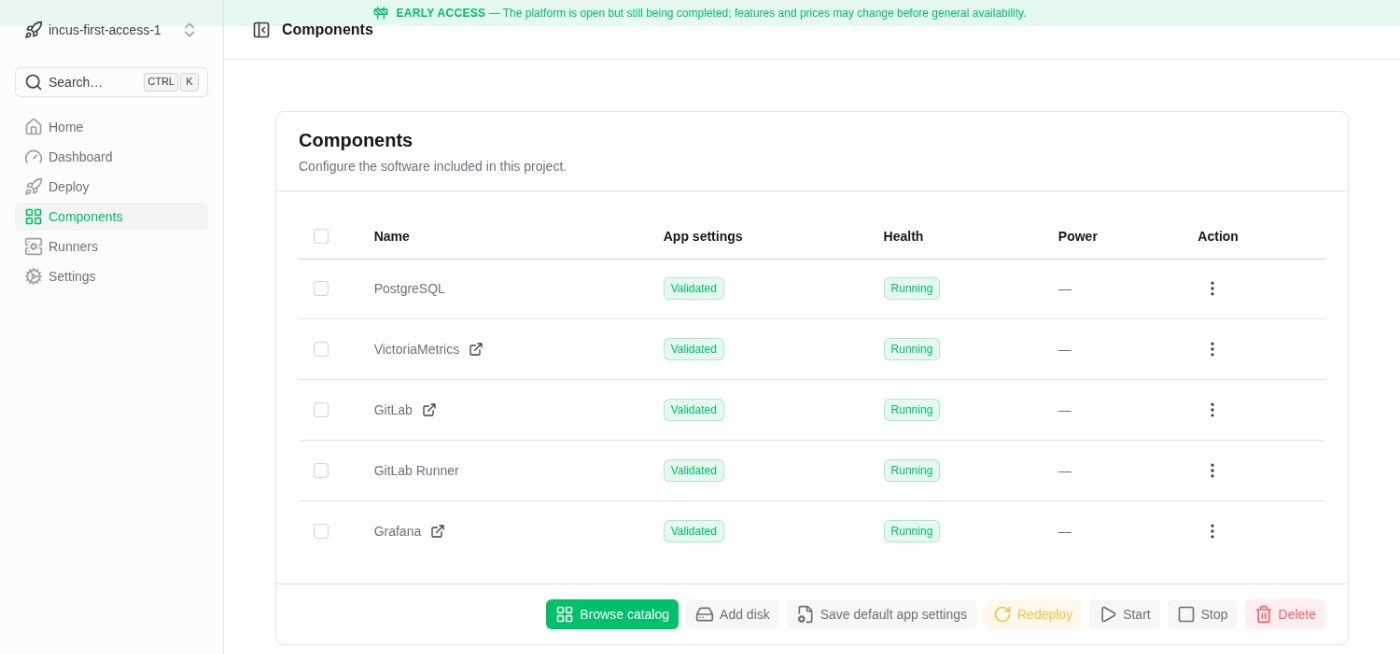
Five components
on hardware we own
The five components the First access plan buys, deployed onto a small Incus cluster of our own with no cloud account anywhere, put to work by a pipeline for an hour, then taken down again.
The code
Somewhere to put the code, something to build it
The first thing a project needs is a place for its code and a machine that builds it. The platform deploys GitLab and a runner, and the runner registers itself against the GitLab beside it.
Its registration token never sits in a configuration file. The deployment pipeline delivers it into the runner’s machine once the machine exists, and the runner comes up already online.
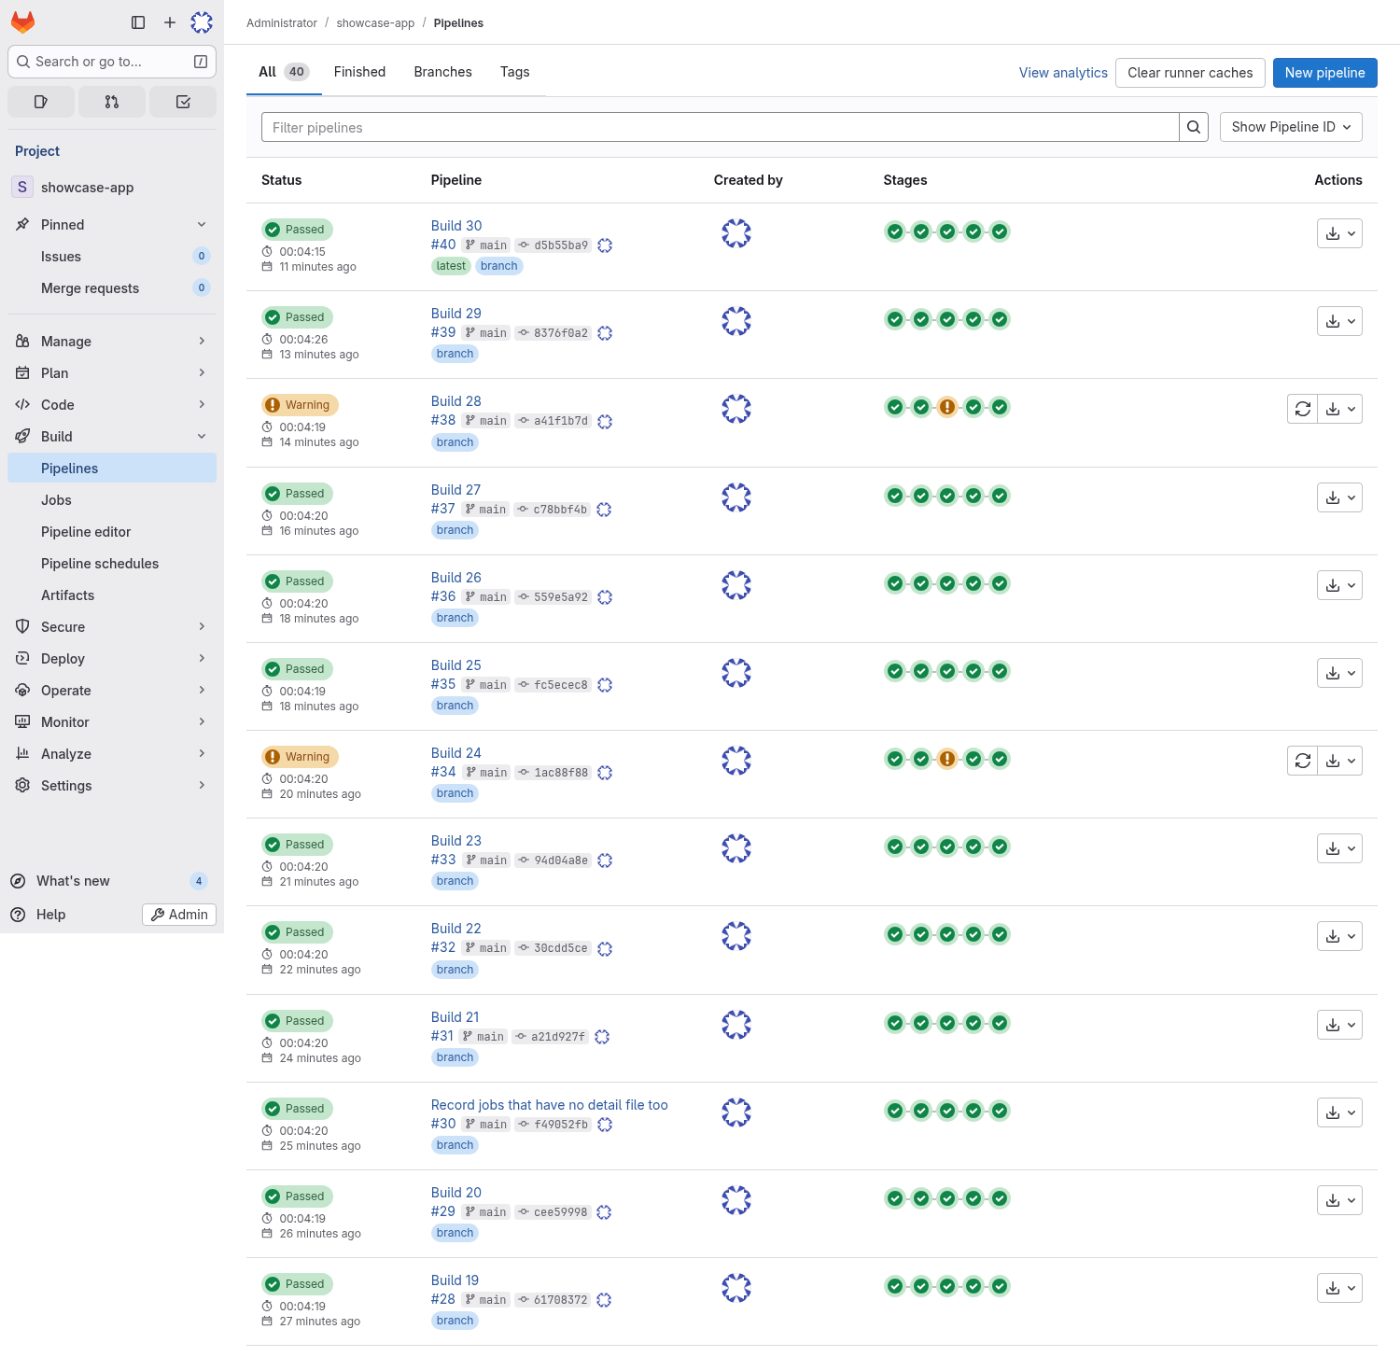
The runner is the project’s own, on a machine of the cluster, not a shared pool somewhere else. Nothing the project builds leaves hardware its owner controls.
The pipeline
Build, compute, test, record
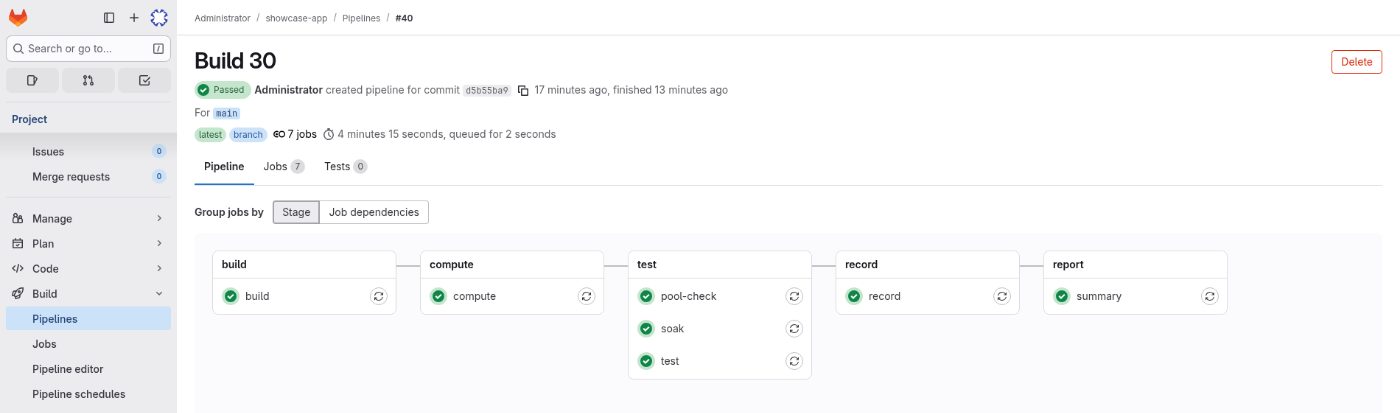
Each commit starts the same pipeline. It compiles a small program, then does some arithmetic on the build number: whether it is even or odd, and whether it is prime.
It tests against the project’s PostgreSQL and records the build there. Beside the tests run a four-minute soak job and a connection check that fails now and then, the way checks in real projects do. The pipeline allows that check to fail, so the build still goes through.
The record
Every job leaves a row
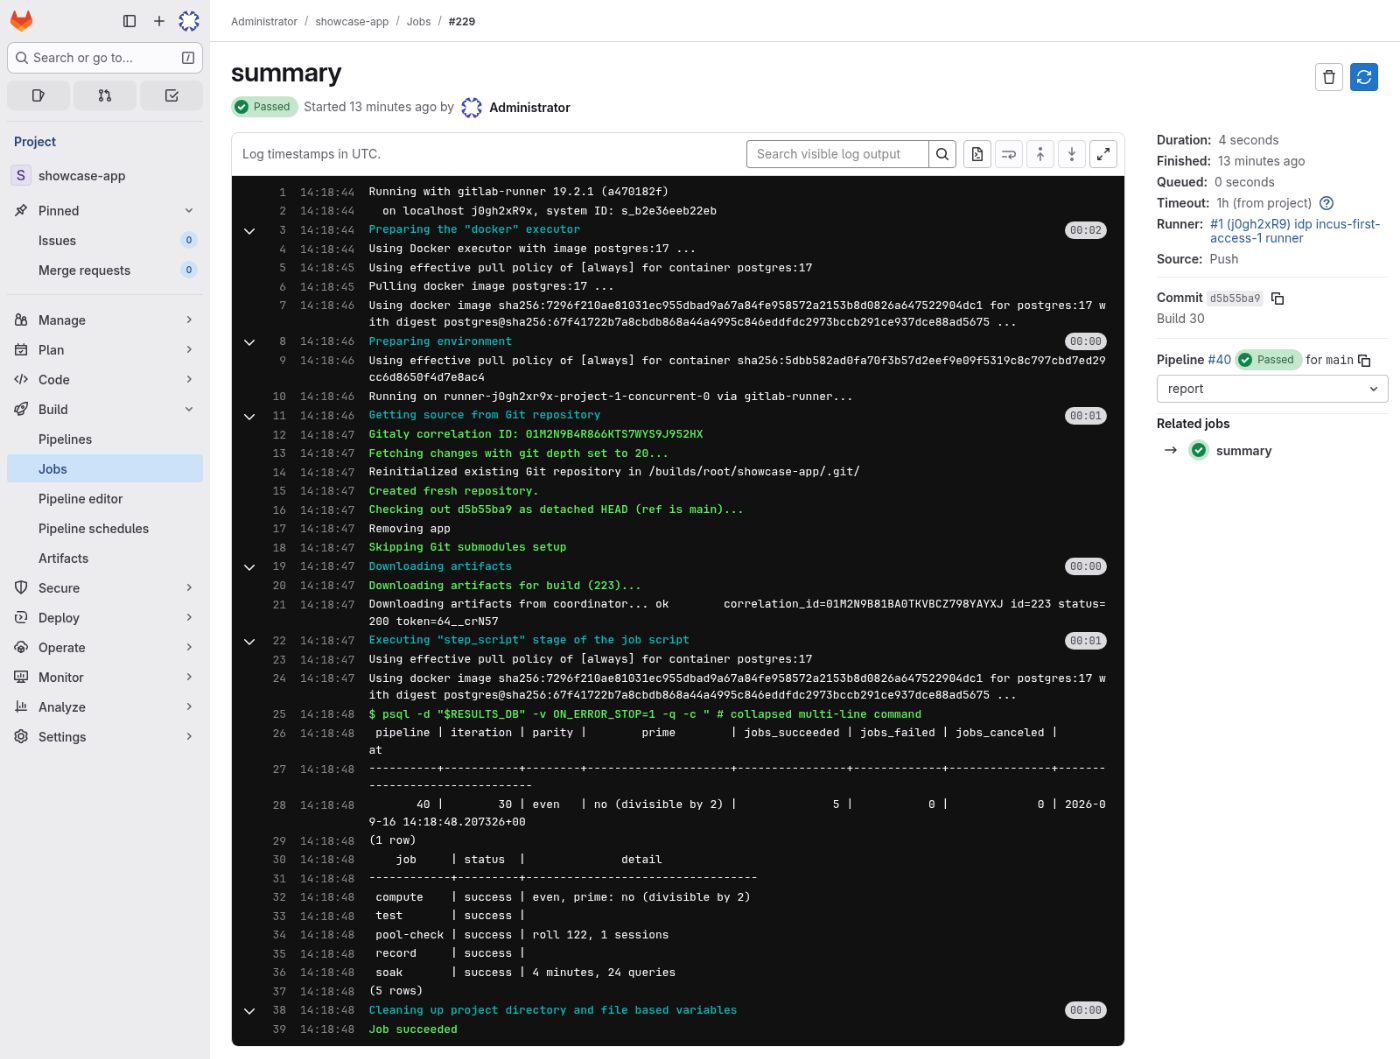
When a job ends, whatever its outcome, it writes one row into a database kept for the purpose, next to the application’s own data in the same PostgreSQL.
A last job writes the pipeline’s result: the build number, its parity, whether it is prime, and how many jobs succeeded or failed.
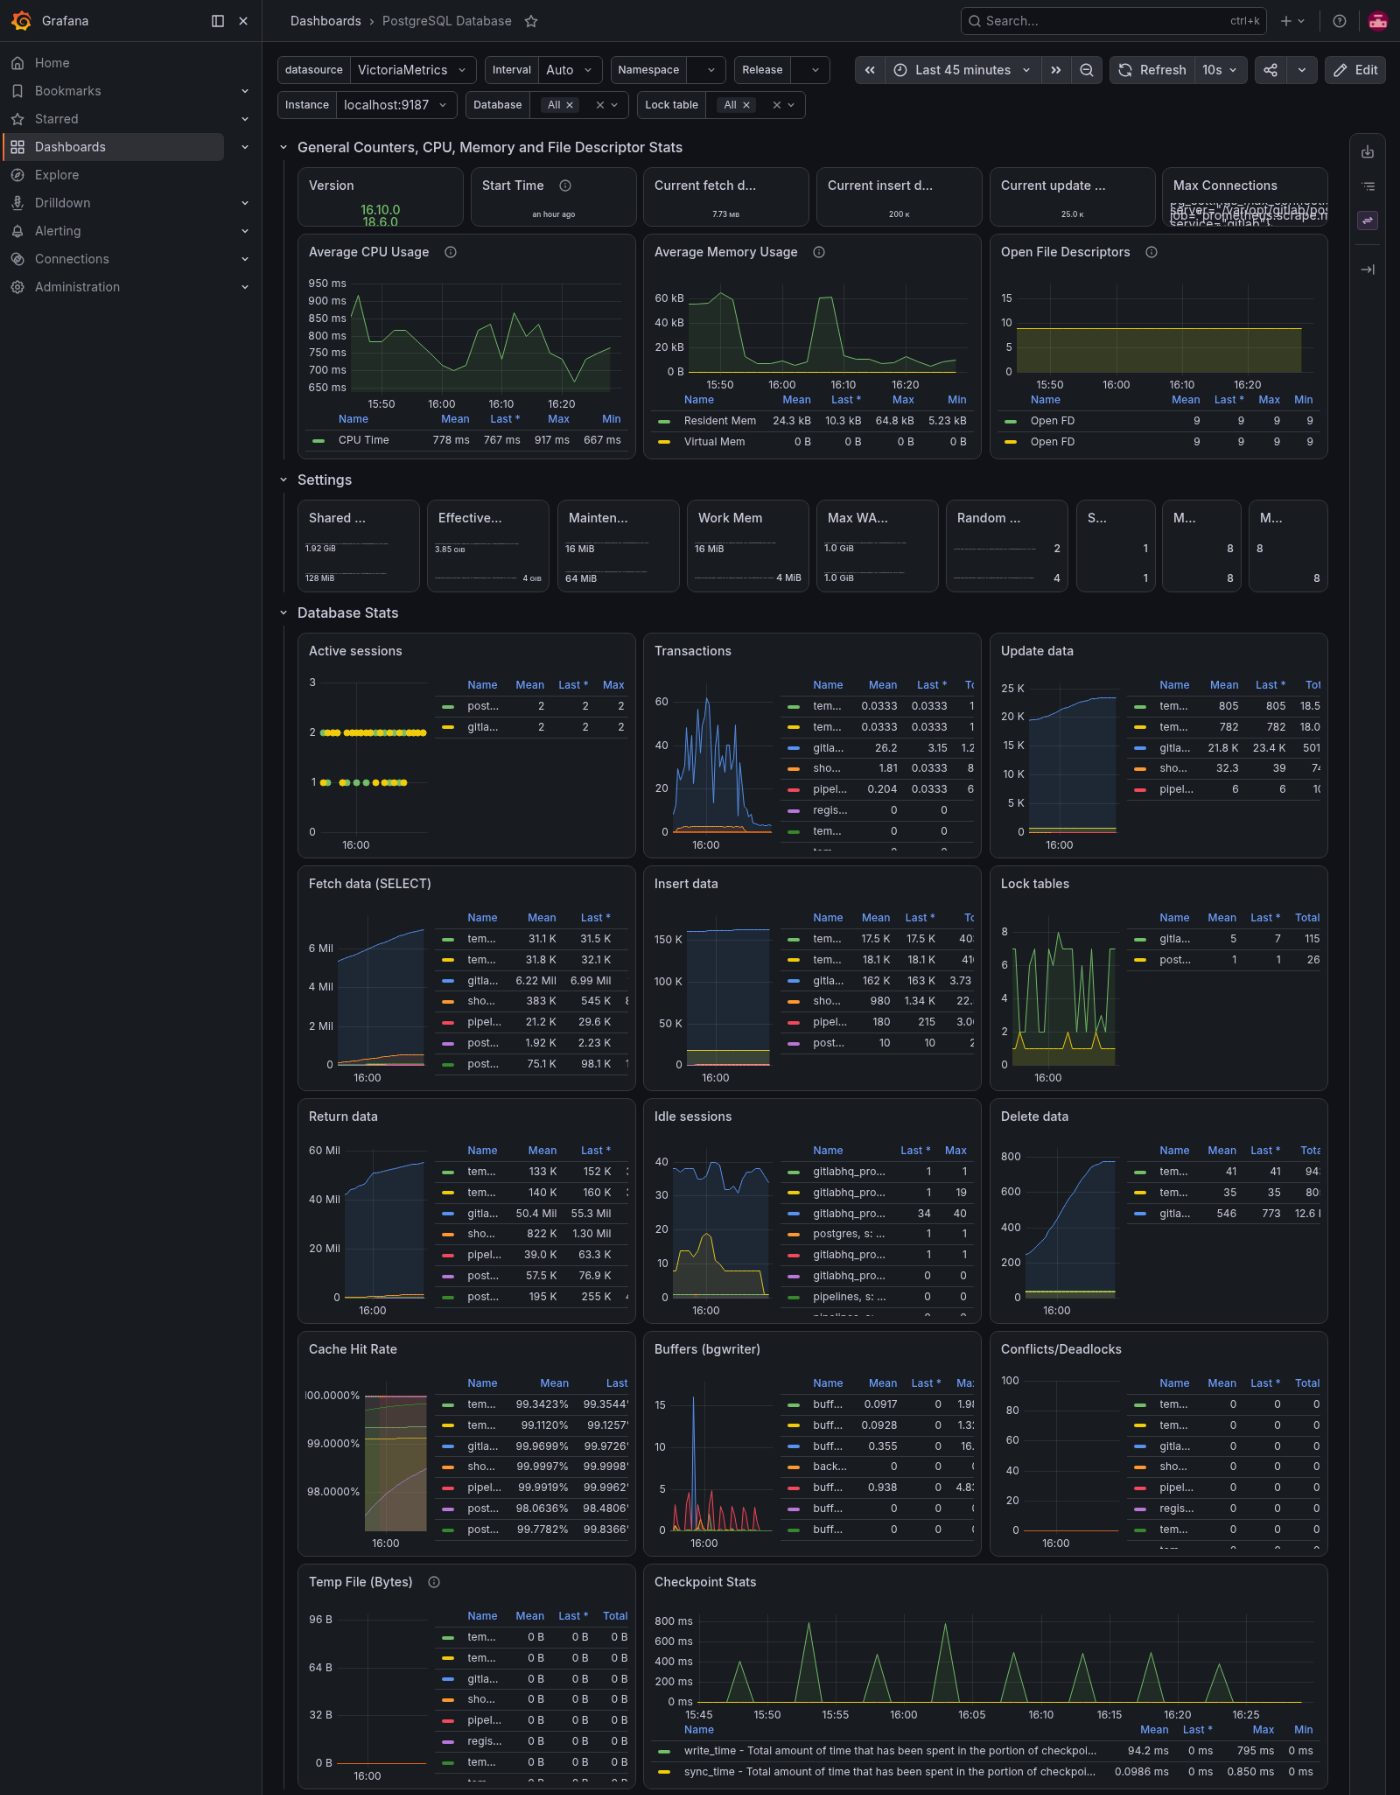
The database board is the same board a team would watch in production: connections, transactions, rows written and read.
The work
Jobs running, jobs failing, all of it visible
Commits come every minute or two, so the runner is rarely idle. Its board shows the jobs running at each moment, how long they take, and the failures as they happen.
GitLab keeps its own board beside it, so a slow build can be traced to the runner or to the server without guessing.
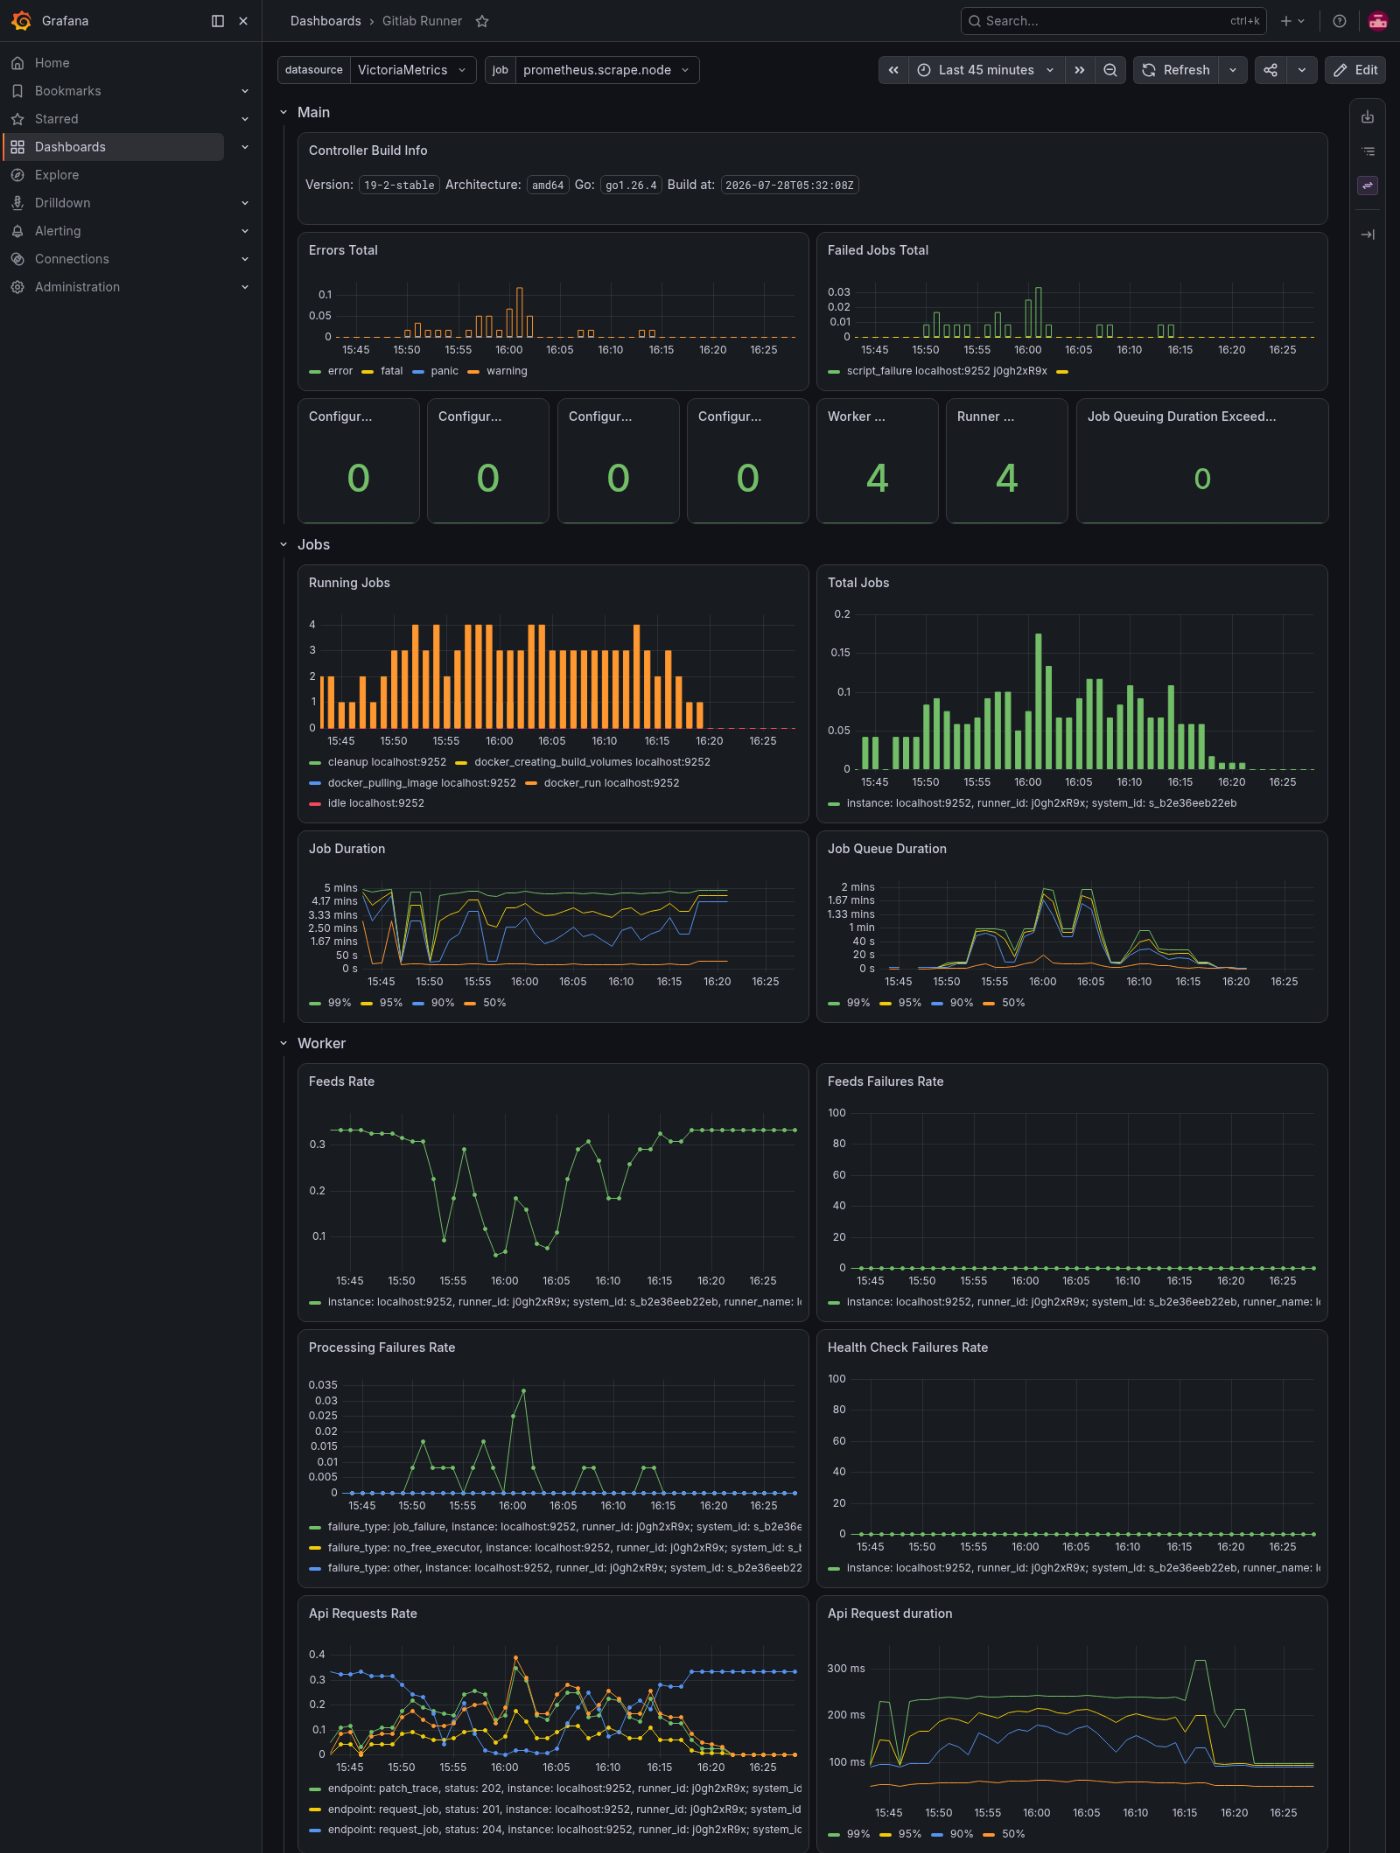
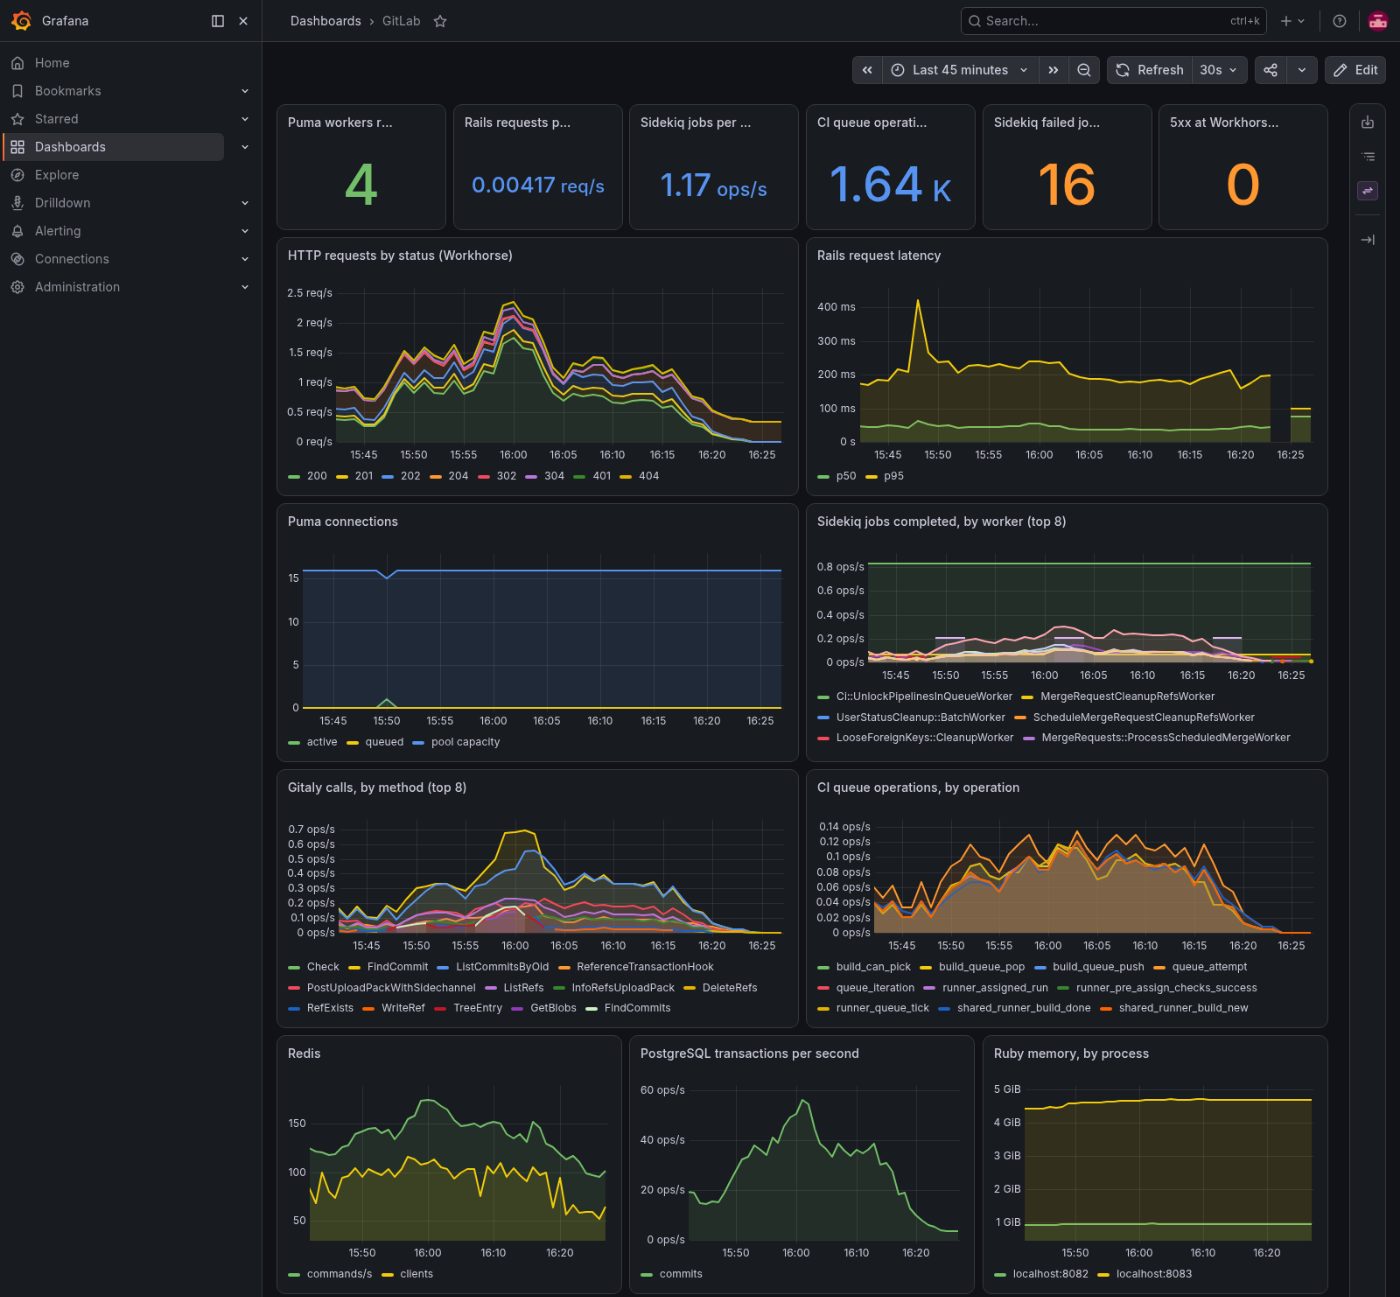
The failures are the flaky connection check. It fails at random on about two builds in five, which gives the failure panels something real to show.
The metrics
One store, every machine reporting
VictoriaMetrics is the fifth component, and it is what makes Grafana worth having. Every machine ships its host metrics to it from the moment it is born, along with the metrics of the service it runs.
Grafana reads that one store for every board, so the database, the code server, the runner and the store itself are watched in the same place.
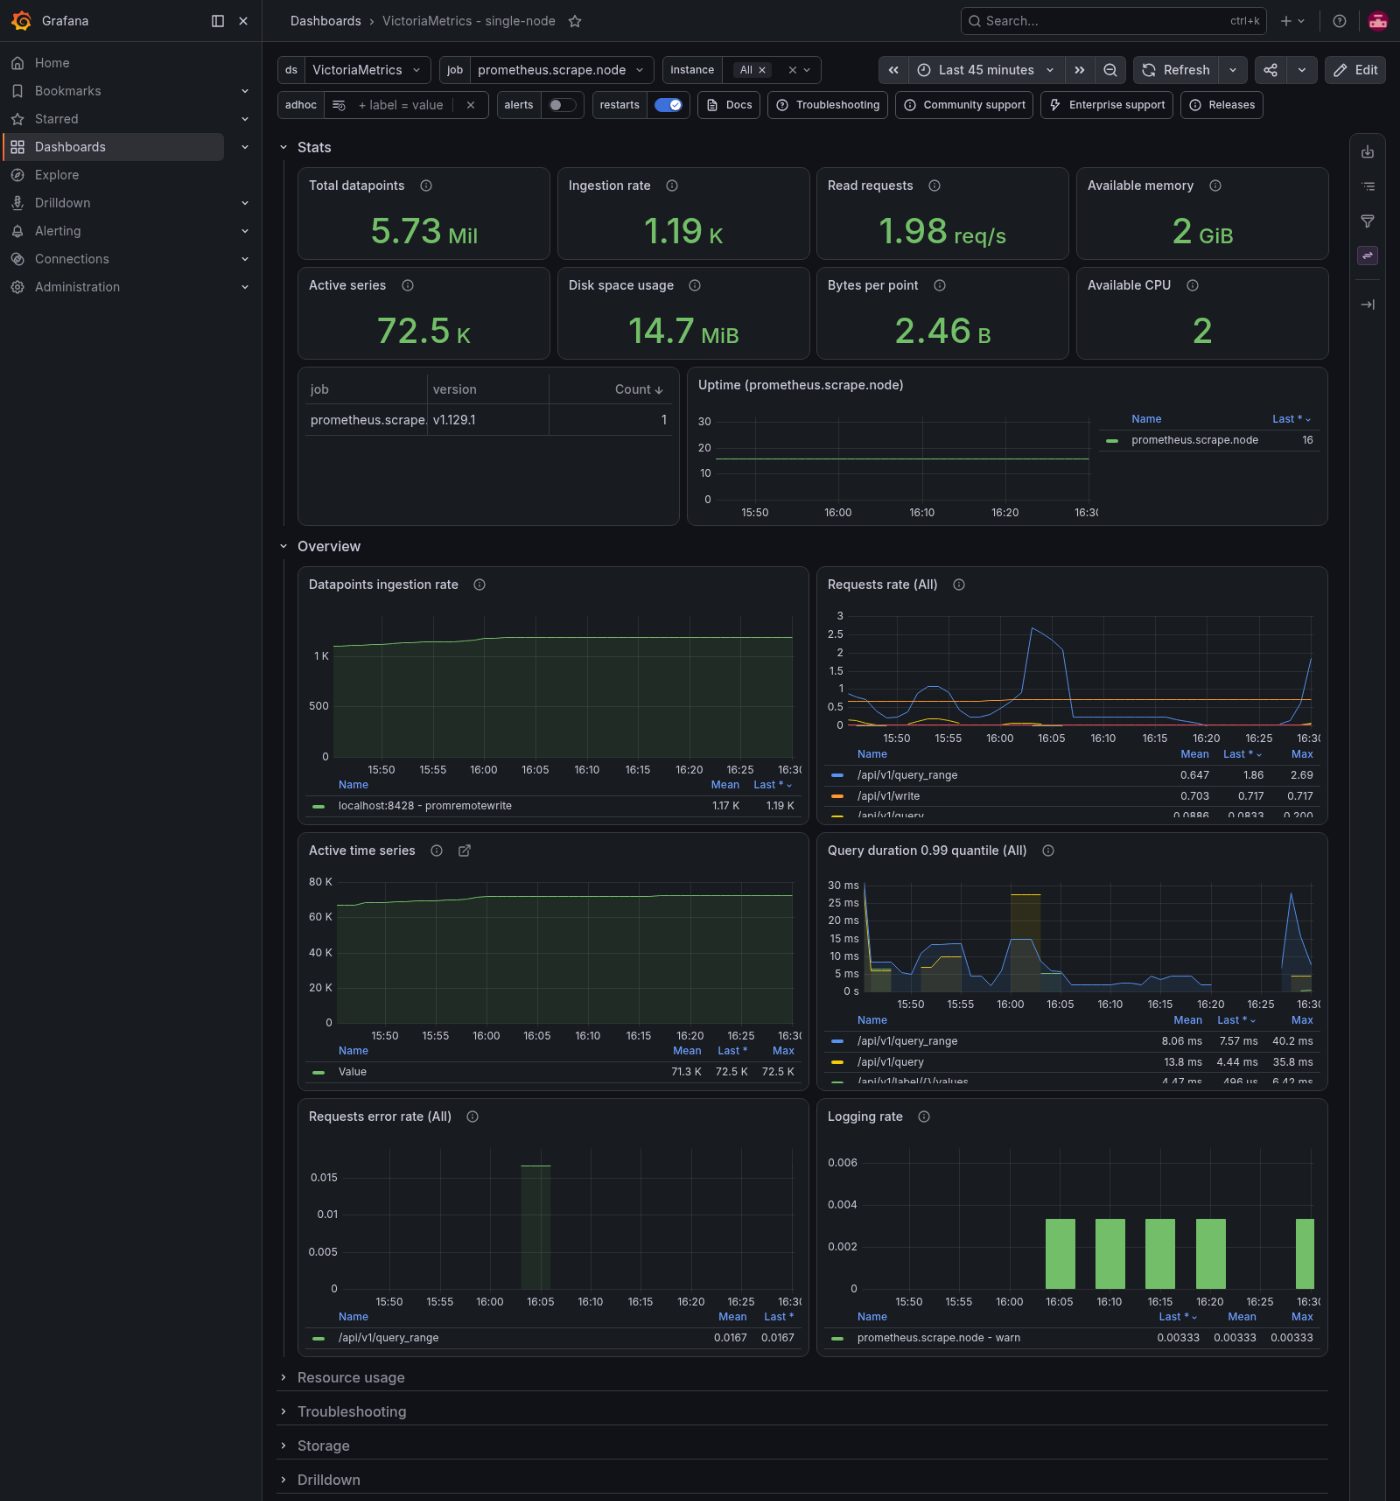
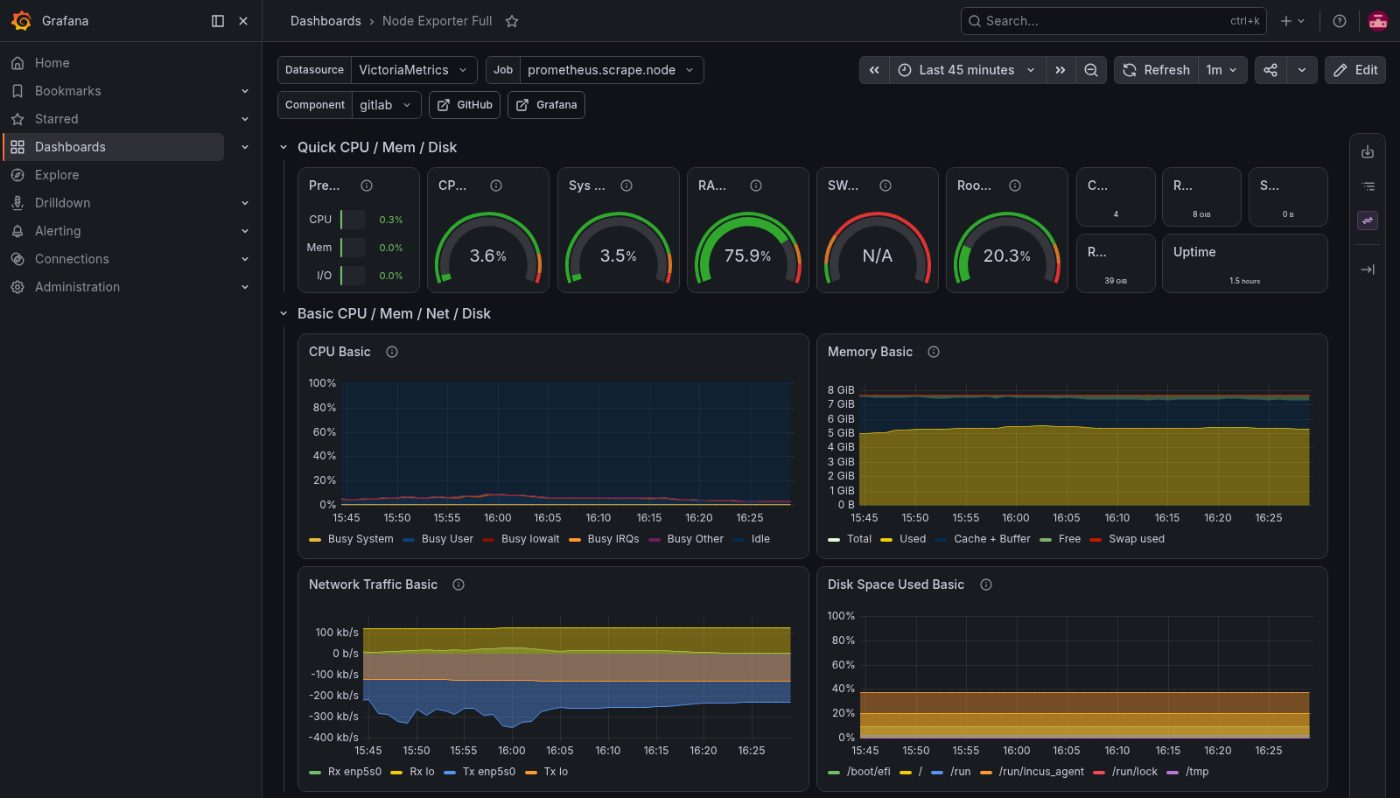
Nobody had to add this. Metrics collection is part of how every machine is deployed, not a component to remember.
What the day added up to
- Components
- 5: four containers, GitLab as a virtual machine
- Infrastructure
- An Incus cluster of our own, no cloud account
- Pipelines
- 38 on main, 35 passed, 11 of them past a failed flaky check
- Jobs
- 215, all on the project's own runner
- Secrets in configuration
- None: delivered into each machine by the pipeline